

When I tell people that I work in SEO + Analytics, I get a lot of side eyes and blank stares.
via GIPHYAfter the initial moment of silence, most people launch directly into questions about Google Analytics.
Like, Why is it so d#%$@ confusing?
From what I can tell, there are a million reasons why Google Analytics is so confusing:
- There are more than 27 million websites that use Google Analytics.
- Google Analytics is a difficult tool to learn. In fact, 89% of marketers say they want to improve their knowledge of Google Analytics.
- Between metrics and dimensions, there are more than 500 unique pieces of data you can access using Google Analytics.
So overwhelming that even though most websites have Google Analytics, most website owners never log into it.
And this, my friends, is a tragedy.
How can you grow your business if you don’t even have a starting point?
At Clapping Dog Media, we understand Google Analytics and SEO Reporting. Our goal is to translate the data to make it understandable and actionable.
For our clients, we extract the data that matters and make sense of it so that our clients can increase traffic and sales.
When we work with small businesses on SEO we provide what they need to make data-driven decisions and we make it super-easy to see exactly what channel is growing and what content is driving engagement.
The Metrics that Matter
Our analytic reporting starts with the Metrics that Matter to Google (and to me!)
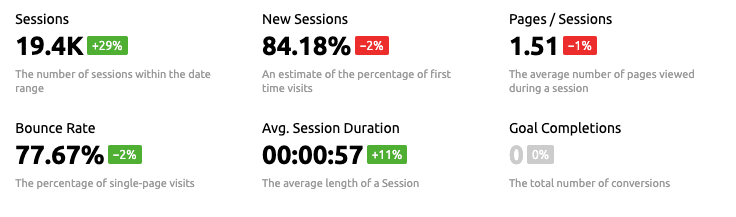
Sessions
This is traffic. We want to see this number getting higher month over month.
Sessions are a very clear indicator of the SEO health of your site (and your business). This is one metric that I watch closely with every client.
New Sessions
This is a measurement of new users.
Are we casting a wide net that attracts new users to the site. We generally want 75-85% of the traffic to the site to be new.
Pages/Session
Pages/Session is an engagement signal.
If users click around and read multiple pages on your site then Google will assume that you are an expert and have authority. The average across the internet is 1 page/session, meaning users land on a page and then bounce back to the Search Results page or another site.
A good goal is to have the Pages / Session above 2.
Pro Tip: One way to increase your Pages/Session is to make it SUPER easy for users to find similar pages on your site so think about adding links in your content and having related posts easy to find and click on.
Bounce Rate
The bounce rate is the percentage of people who arrive at your site and leave without viewing another page. A bounce rate below 70% is a good goal.
Bounce rate is another quality rating. If users don’t stick around on the site, they didn’t find the answer they were looking for easily.
Avg. Session Duration
This is a strong quality signal to google. From Google’s perspective, if users are spending time on your site then the content must be high quality (otherwise they would leave, see bounce rate). The average attention span of a user on the internet is 12 seconds, so if a site can grab the users attention and entice them to read an article, to click through a gallery or to watch a video, then the content must be good.
The average session duration across the internet is literally seconds, a good goal is 90 seconds, now this isn’t a lot of time either but it is enough time for users to learn something and to send positive signals to Google.
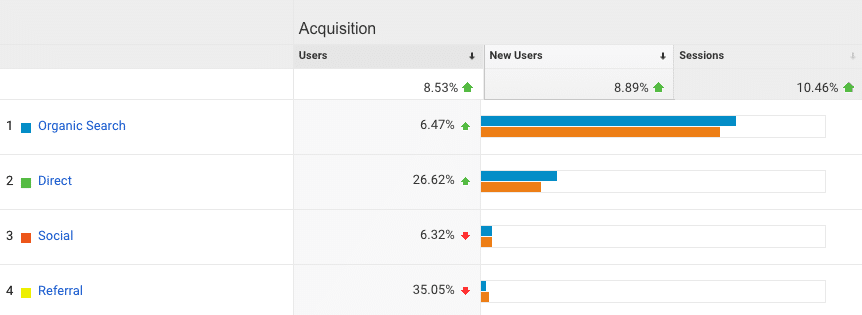
Where is your traffic coming from?
Is all that effort making TikTok videos worth it?
Does the 3 years of blog content attract users?
It is so important to measure where traffic comes from? And how does that compare month over month?
Ideally Organic/Google traffic should be the highest piece of the pie, followed by Direct. Direct Traffic comes from users who already know you and type in the URL directly into the browser. Organic and Direct traffic work together, once a user finds you from Google, they likely become direct traffic.
The rest of the pie should be somewhat balanced. The big idea is to have users coming to the site from multiple sources.
What content are visitors engaging with?
Engagement this is important and is directly related to the Metrics that Matter above. We don’t just want traffic to pop on the site and bounce quickly, we want traffic that binges your content like I binged Bridgerton on Netflix.
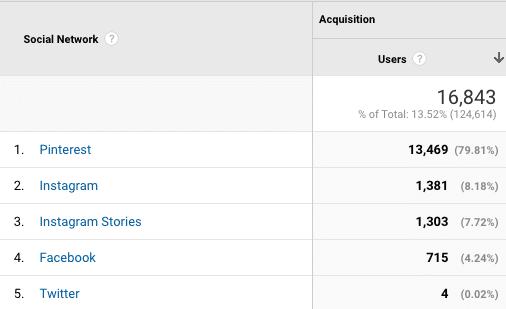
Social Traffic
Social is a part of every marketing strategy. There are roughly 2.8 billion active users on Facebook alone. If you want to reach more people, then you need to go where they are.
But. You don’t have to be everywhere — you must measure what is working and invest more time and money there.
In the example client here, you can see that they only had 4 users come to their site from Twitter and 1303 from Insta Stories — but the thing is the client was posting as much on Twitter as she was on Insta Stories — but after this report we could safely say stop posting on Twitter — it isn’t driving traffic!
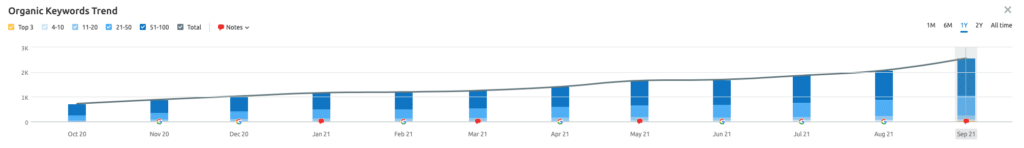
Ranking Keywords
The more keywords that your site ranks for the more organic traffic you will have. It is important to measure the number of keywords month over month.
Now that wasn’t so bad was it.
If you have context for what each metric means and are presented the data via easy-to-understand reporting, using data to drive strategy is fun and effective.